Adding the visual to a report
We recommend you add the visual to a Power BI page with a canvas size of minimum 900 x 1700px to be able to show enough data in different columns.
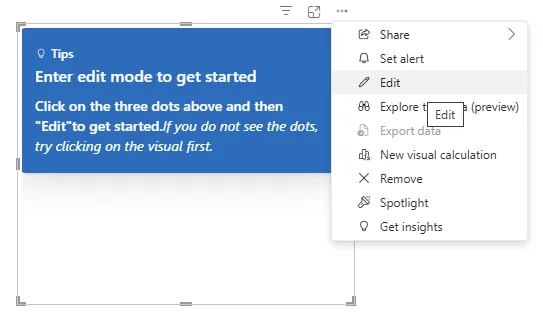
When you have added the visual, a blank area is showed in Power BI. Click on the three dots in the upper right corder and choose Edit.

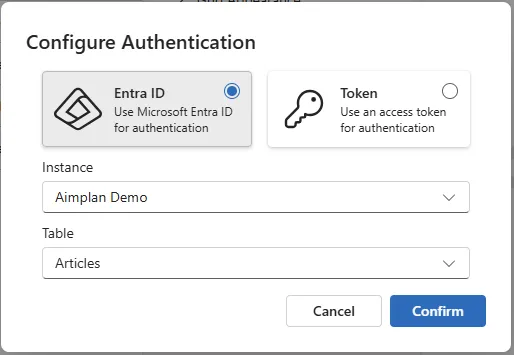
The first time you go into edit mode, you'll need to choose which authentication method to be used. The default is Entra ID which is the recommended authentication method. To use Entra ID, you must configure Power BI to allow SSO capability to custom visuals. For more information to enable Entra ID, see here: Entra ID
If you prefer access token, you click on the Token button and paste the token. The token can be generated in the Portal, see: Other Portal Options. When using Access Token, you also must add the User Key in the "Aimplan User Key" field in the Visualization tab Power BI. Here can you read more about the User Key Aimplan User Key configuration
Depending on the authentication method, you'll need to paste the Token (see above) or choose an Instance you want to work with. Select the Instance in the drop down. When an Instance i selected, you can choose wich Storage Table the Data Input Table should work with.
