Filter Rows Using Calculation Groups
When setting up an Aimplan Planning and Reporting Visual in Power BI, you might encounter a common issue: the visual generates too many rows, exceeding Power BI’s 30,000-row limit.
To address this, it is essential to understand:
- Why the row count increases significantly.
- Which rows are actually necessary for your visual.
You can find more information on this in the article: Limit/Expand Number of Rows in Your Visual
This chapter focuses on using calculation groups to effectively manage and limit rows in your visuals.
When designing reports, reducing the number of user interactions (e.g., clicks) is key. For instance:
- Instead of requiring users to select both a scenario and a planning period, the visual can infer the period from the scenario.
- Similarly, a single company slicer can filter related dimensions like cost centers or accounts, avoiding multiple slicer selections.
This guide demonstrates how to:
- Limit the planning period based on a scenario slicer.
- Use a company slicer to filter multi-company dimensions.
In Aimplan, the portal allows you to define the start and end dates for each scenario.

This means you can link the planning period directly to the scenario dimension, eliminating the need for a separate date slicer. To do this you need to Create a Measure for the Scenario Period.
This measure returns 1 for every date within the scenario's start and end dates:
When working with multi-company dimensions, cross-joins are often required to filter valid combinations of dimensions (e.g., company, cost center, account). In chapter Multi Company Solution you can read more on this subject.
Add a measure that generates values for valid company-dimension combinations:
Calculation groups can dynamically apply filtering logic across multiple measures in your visual. Follow these steps:
- Open the Model View in Power BI.
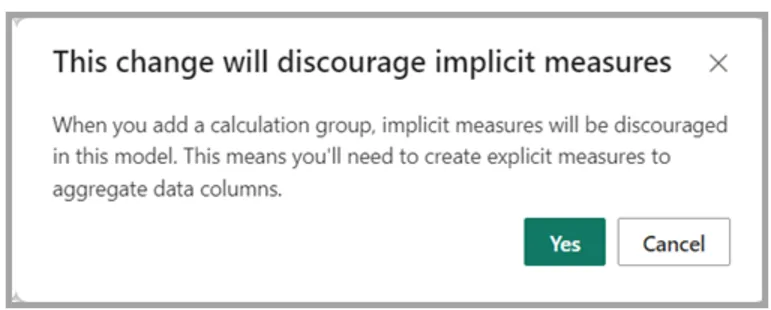
- Create a calculation group. If prompted to enable the "Discourage Implicit Measures" property, select Yes.


Once you select Yes, or if you had already enabled the discourage implicit measures property, a calculation group is added, and you can define the DAX expression of the first calculation item in the DAX formula bar.

Use the following DAX expression to filter rows based on the SelectedCombinations and ScenarioPeriod measures:
Here, SELECTEDMEASURE() dynamically applies the filtering logic to all measures in the visual.

- Add the calculation group (e.g., FilterRows) to the planning visual.
- This ensures the visual only includes rows with valid company-dimension combinations and dates within the selected scenario period, as it only displays values when both the scenario- and company-statement in your SelectedCombination-measure is true.
With these configurations:
- Selecting a scenario slicer (e.g., "Budget 2024") automatically filters the planning period to match the scenario's defined dates.
- Selecting a company slicer filters related dimensions like accounts and cost centers, ensuring valid combinations only.
The visual dynamically adapts, reducing unnecessary rows and improving user experience.
See in the picture below how the scenaro slicer Budget 2024 results in that the period in the visual is 2024-01-01 - 2024-12-31, including a last year value calculation.

For additional guidance on calculation groups, go to the official Microsoft documentation